Proud to release a first version of the UGLab project.
UGLab is a python open source project capable to execute Urban Growth predictions for any geographic area available on CORINE dataset.
Consult our wiki pages for for further info.
You may find a detailed description about the flow here--> flow diagram
There is also a related paper --> "Analysing urban growth using machine learning and open data: An artificial neural network modelled case study of five Greek cities"
https://www.sciencedirect.com/science/article/pii/S2210670722006412
Prerequistics
- Set up a python 3.7 environment.
The project has been tested under the following environment.
Python: 3.7.6
platform: Windows-10-10.0.19041-SP0
pip: n/a
setuptools: 58.2.0
setuptools_rust: 0.12.1
- Install GDAL. Further info can be found here. (if you face any problems installing GDAL then try to install OsGeo)
- Pip install the following libraries
keras
numpy
gdal
rtree
sklearn
matplotlib
- Download the project and extract it locally
Run Demo project
- Run the uglab_demo.py script within the root of the project
For demonstration purposes we include a subset of the Pan -European datasets needed to run the project.
This is a demo project for city of Munich, Germany.
Related data sources are placed within _uglab_source_demo_data folder.
All generated files will be placed within _uglab_demo_project folder.
Also notice the existence of MUNICH_MBR.shp within _uglab_demo_project folder, this is the study area for our demo (munich).
The whole procedure to complete will take from 15 minutes to 1 hour depending on the machine running it. Consider, that you should have internet access during the runtime to download OSM data for your study area.
After script completion your _uglab_demo_project folder should be fulfilled with the intermediate produced data.
There should also be a new folder ml_data containing the final data, including:
- 1 plot for the feature impact using the Linear Regression method
- 1 plot for the feature impact using the Random Forest method
| Feature Impact - Linear Regression | Feature Impact - Random Forest |
|---|---|
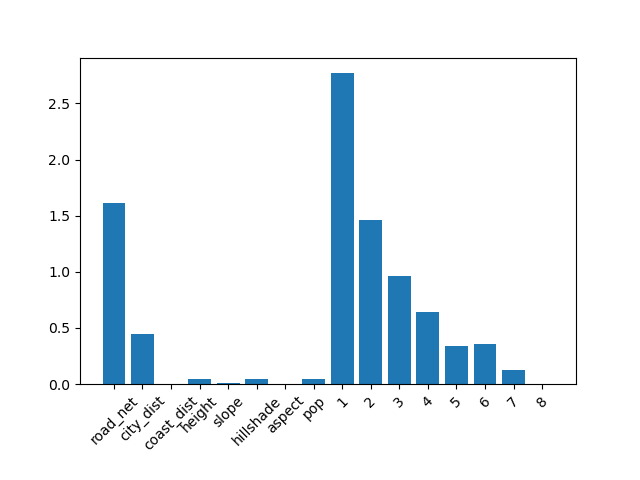 |
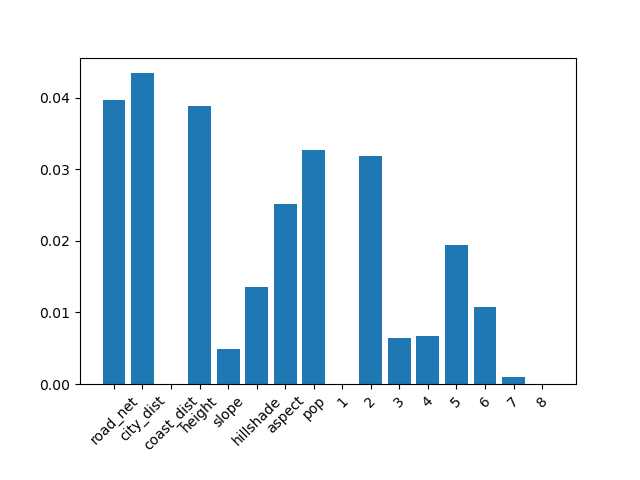 |
- 1 plot for Accuracy learning curves
- 1 plot for Loss learning curves
| Loss learning curves | Accuracy learning curves |
|---|---|
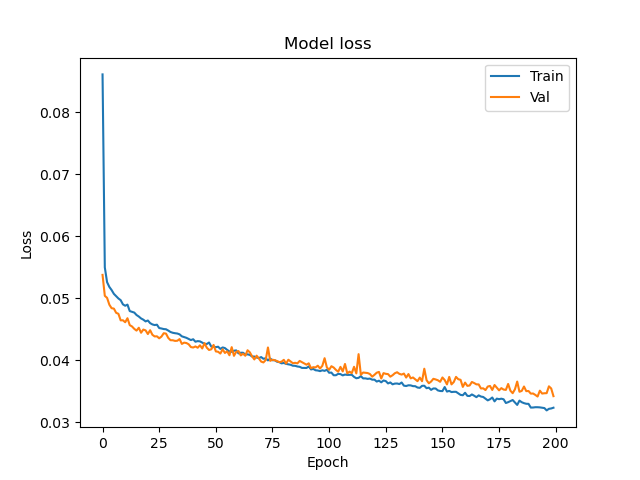 |
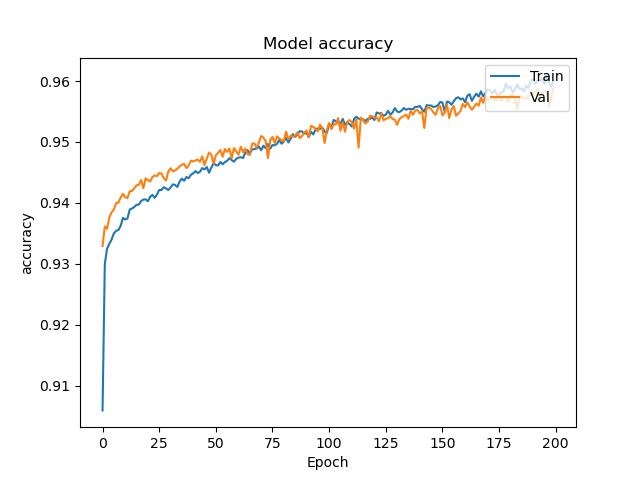 |
- 1 csv file containing x_coord, y_coord, urban/nonurban 2006, urban/nonurban 2018, urban/nonurban 2018 - predicted eg.
| x_coord | y_coord | 2006 real | 2018 real | 2018 predicted | 2030 predicted |
|---|---|---|---|---|---|
| 2414480.54 | 4622802.23 | 0.00 | 0.00 | 0.00 | 0.00 |
| 2414628.43 | 4622802.23 | 0.00 | 1.00 | 1.00 | 1.00 |
| 2414776.31 | 4622802.23 | 0.00 | 0.00 | 0.00 | 0.00 |
| 2414924.19 | 4622802.23 | 1.00 | 1.00 | 1.00 | 1.00 |
................................................
- 1 geotiff for the period 2006-2018 holding real changes
- 1 geotiff for the period 2006-2018 holding predicted changes
- 1 geotiff for the period 2018-2030 holding predicted changes
| 2018 REAL | 2018 PREDICTED | 2030 PREDICTED |
|---|---|---|
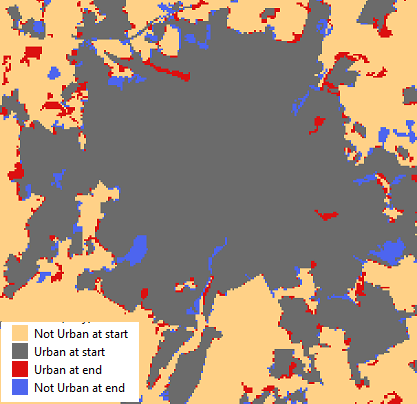 |
 |
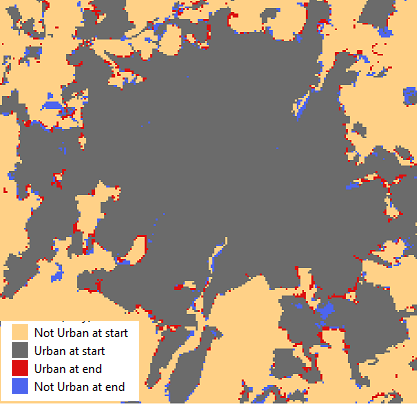 |
Running UGLab for your own study area
If you managed to run the demo project then you are ready to run it for your own study area.
To do so, you need to download the pan European datasets and also create a new shapefile holding a rectangle expressing the mbr of your area.
You may find detailed instructions about that within our WIKI
Citing UGLab
If you use UGLab in your research and want to cite it, please use this reference:
https://doi.org/10.1016/j.scs.2022.104337
UGLab websource: https://github.com/ptsagkis/UGLab/wiki
